Forex risk management: why drawdown percentage spikes
Drawdown rarely explodes because of one bad trade. In my experience testing retail platforms and watching live accounts under pressure, the damage usually comes from a stack of small decisions that…
Kevin Palmer·Updated: July 14, 2026·16 min read
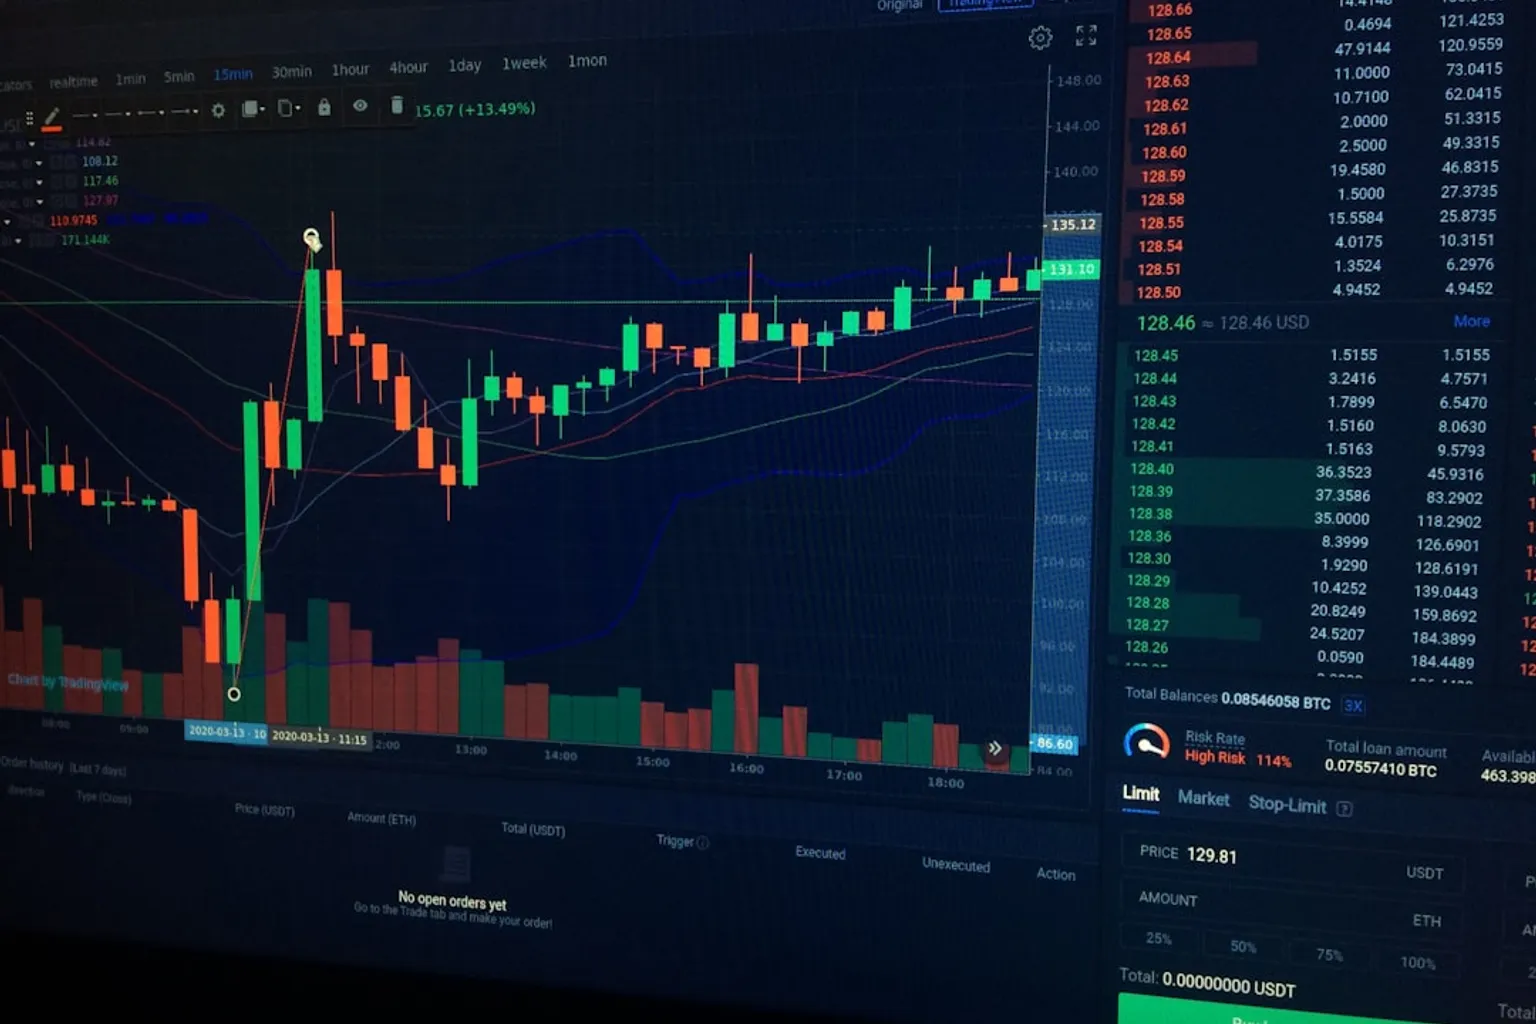
Drawdown rarely explodes because of one bad trade. In my experience testing retail platforms and watching live accounts under pressure, the damage usually comes from a stack of small decisions that look harmless in isolation: a slightly larger lot size, a stop moved “just this once,” three correlated dollar positions, and a news candle that fills the stop 8 pips worse than expected.
That is where forex risk management becomes more than a neat spreadsheet concept. It is the difference between a normal equity dip and a drawdown spike that changes the trader’s behavior. Once the account is down hard enough, the platform is no longer the main problem. The trader becomes the execution risk.
The mechanics of drawdown: why account equity erodes
Drawdown is the decline from an account’s equity peak to a later trough. If a $10,000 account rises to $11,000 and then falls to $9,900, the drawdown from the peak is 10%. That sounds clean on paper. On a live forex account, it is messier because equity moves with open positions, spreads widen, stops slip, swaps accumulate, and margin can tighten the trader’s room to operate.
The first point I look at is whether the drawdown is normal for the strategy or abnormal for the trader.
A trend-following swing system may sit through several losing trades before catching a larger move. A scalping strategy may take more trades with smaller stop distances, but it is more exposed to spreads, execution speed, and slippage. Both can show drawdown. The issue is whether the loss curve matches the method.
A healthy drawdown usually has structure:
- The trade size stays consistent relative to equity.
- Losses stop where the plan said they should stop.
- The trader does not add exposure to “fix” the previous trade.
- The risk-to-reward profile still gives winners enough room to offset losers.
- The platform fills are roughly in line with expected trading conditions.
A dangerous drawdown has a different fingerprint. Lot sizes change suddenly. Stops get wider after entry. New trades appear in pairs that are basically the same macro bet. The account is no longer following a trading plan. It is negotiating with loss.
The arithmetic is unforgiving. A 10% loss needs an 11.1% gain to recover. A 20% loss needs 25%. A 50% loss needs 100%. This is why drawdown percentage spikes matter more than the dollar amount on one trade ticket. They reshape the recovery requirement.
| Account drawdown | Gain needed to recover | Practical meaning |
|---|---|---|
| 5% | 5.3% | Manageable if trade size remains stable |
| 10% | 11.1% | Strategy review zone for many retail traders |
| 20% | 25.0% | Execution discipline usually starts breaking |
| 30% | 42.9% | Recovery often requires either time or excessive risk |
| 50% | 100.0% | The account is effectively in survival mode |
The trap is that the account balance does not tell the whole story. Equity does. A trader can have three open losing positions, a balance that still looks acceptable, and a live equity curve already in trouble. I always treat equity drawdown as the real number. Balance is the delayed report.
Position sizing: where most drawdown spikes are born
The cleanest forex drawdown explanation starts with position size. Most retail traders do not lose control because their strategy has a 42% win rate instead of 48%. They lose control because the trade size is too large for the stop distance and account equity.
The basic formula is simple:
Position size = account equity × risk percentage ÷ stop-loss distance
If the account is $10,000 and the trader risks 1% per trade, the planned loss is $100. If the stop is 50 pips, the position must be sized so that 50 pips equals $100, before spread and slippage. If the stop is 20 pips, the lot size can be larger, but the risk should still be $100. The stop distance changes the position size. It should not change the risk budget.
The common professional range is 1% to 2% of account equity per trade. That does not make the trader safe. It simply keeps the account from getting mathematically cornered too quickly. Five consecutive losses at 1% are annoying. Five consecutive losses at 5% are a structural problem.
Risk per trade is not a motivational setting. It is the circuit breaker between a losing streak and account damage.
The issue I see often is inconsistent sizing dressed up as confidence. A trader risks 1% on a clean setup, loses twice, then risks 3% on the third trade because “the level is obvious.” That third trade becomes the drawdown spike. Not because the setup was impossible. Because the trade was allowed to carry three times the normal damage.
There is also a quiet version of the same mistake: using the same lot size on every trade regardless of stop distance. That feels disciplined because the number of lots stays constant. It is not disciplined. A 0.50-lot trade with a 25-pip stop and a 0.50-lot trade with a 75-pip stop do not carry the same risk. The second one can do three times the damage.
A realistic sizing routine should run in this order:
1. Start with current equity, not original deposit. If the account has fallen from $10,000 to $9,200, the next 1% risk is $92, not $100. This slows the loss curve when conditions are poor.
2. Define the invalidation point before calculating size. The stop belongs where the trade idea is wrong, not where the lot size feels comfortable.
3. Calculate position size from the stop distance. Wider stop, smaller size. Tighter stop, larger size only if the spread and execution quality make that realistic.
4. Add spread and likely slippage to the real risk. On major pairs in liquid hours this may be modest. Around news, rollover, or thin sessions, it can turn a planned 1% loss into more.
5. Reject the trade if the size is impractical. If the correct size is too small to bother with, that is not a reason to increase risk. It is a reason to pass.
This is where position sizing calculators help, but I do not treat them as protection by themselves. They are arithmetic tools. They do not know whether the broker widens spreads aggressively at rollover. They do not know whether the trader will move the stop after entry.
Risk-to-reward is not decoration
Drawdown spikes are not only about how much is risked. They are also about whether the average winner pays enough to cover the average loser. A risk-to-reward ratio of at least 1:2 is often recommended because it gives the strategy breathing room. If the trader risks $100 to make $200, the system does not need to win every time to survive.
This gets abused in two ways.
First, traders mark a 1:2 target on the chart but close winners early after 0.6R or 0.8R. The spreadsheet says 1:2. The account history says something else. Second, they use a distant target that price rarely reaches, while the stop gets hit cleanly. That produces a pretty chart and a poor equity curve.
The realistic question is not “does the setup offer 1:2 on the chart?” The question is whether the pair, session, volatility regime, and execution costs make that 1:2 achievable often enough.
For example, a tight intraday EUR/USD setup during London-New York overlap may support a clean 1:2 if spreads are narrow and execution is fast. The same structure on an exotic pair with a wide spread can be a different trade entirely. The chart pattern may look similar. The cost structure is not.
Here is the part retail traders tend to underprice: spread is paid immediately. If a trader is scalping with a 6-pip stop and a 12-pip target, a 1.2-pip spread is a large tax. Add slippage and the clean 1:2 can become a much weaker real ratio. On paper, the stop and target are symmetrical enough. In the terminal, the fine print eats the edge.
Revenge trading: when drawdown becomes behavioral
Most drawdown spikes I have reviewed have a behavioral phase. The first losses may be normal. The later losses are personal.
Revenge trading is the obvious version: the trader increases position size during a losing streak to recover quickly. It feels decisive. It is usually just leverage wearing a costume. The market does not know the account is down 8%. It does not owe the trader a cleaner signal or a faster recovery.
The more subtle version is strategy hopping inside one session. A trader starts the day trading price action breaks, loses twice, then fades the next breakout, then takes a news scalp, then adds a swing position because the daily candle “still looks bullish.” By the end of the day, the account has not followed one bad plan. It has followed no plan.
This is why I prefer hard drawdown rules that remove discretion when the trader is least qualified to use it. Not because rules are elegant. Because tired traders are poor risk managers.
A practical set of limits can look like this:
- Daily loss stop: after losing a fixed amount, such as 2% to 3% of equity, no more new trades that day.
- Consecutive-loss pause: after three planned losses, stop trading and review screenshots before taking another setup.
- Weekly drawdown cap: if the account falls by a defined threshold, reduce size or stop until the next trading week.
- Strategy lock: do not switch methods during a session to win back losses.
- Post-news delay: avoid entering immediately after major economic releases unless the strategy was built specifically for that environment.
These rules sound basic until the account is bleeding. Then they become the only thing between a normal losing streak and a risk-of-ruin problem.
Risk of ruin in forex is not just a formula from a trading book. It is the practical probability that a trader damages the account enough that the strategy can no longer operate properly. High leverage, oversized positions, and low discipline increase that probability fast. A strategy with a real edge can still be ruined by trade sizing that assumes the next winner must arrive on schedule.
The market can hand you five bad trades in a row without doing anything unusual. Your sizing decides whether that is a bruise or a fracture.
Volatility and slippage: the hidden drivers of unexpected spikes
Retail traders often blame the strategy when the real culprit is the execution environment. I am not saying brokers cause every bad outcome. That is lazy. But spreads, slippage, order type, and session timing absolutely affect drawdown.
Slippage happens when an order is executed at a different price than expected. With stop-loss orders, negative slippage means the exit fills worse than planned. A stop intended to lose $100 may lose $125 or $160 in a fast market. During news events, thin liquidity, or weekend gaps, that difference can be larger.
This matters because many risk models assume the stop is a fixed wall. It is not. In forex, a stop is an instruction to execute once price trades at the stop level. It does not guarantee the exact fill price in all conditions.
The most common execution-related drawdown drivers are:
1. News volatility. Inflation reports, central bank decisions, labor data, and surprise policy comments can move currency pairs sharply. Stops can slip and spreads can widen at the same time.
2. Rollover conditions. Around the daily rollover, liquidity can thin and spreads may widen. A stop that is safe in the middle of London trading may be exposed in that window.
3. Exotic and minor pair spreads. The nominal chart setup may look attractive, but the entry cost can be too high relative to the stop. This is especially damaging for short-term strategies.
4. Platform delays and freezes. A few seconds matter during fast movement. I pay attention to execution speed because “clicked at the price” and “filled at the price” are not the same thing.
5. Stop clustering near obvious levels. Stops placed directly beyond round numbers, session highs, or recent swing points can be vulnerable to liquidity sweeps. Sometimes the level is correct. Sometimes it is just crowded.
This is why a forex risk management plan that ignores broker conditions is incomplete. The same strategy can behave differently across brokers because real trading costs differ. Tight advertised spreads do not help much if they disappear during the exact minutes the strategy trades.
A simple adjustment is to classify trades by execution risk. A normal London-session major-pair setup can use standard risk. A pre-news setup, late-Friday trade, or thin-session cross may need reduced size or no trade at all. The chart does not get to overrule liquidity.
Correlation risk: five trades, one bet
Correlation risk is one of the fastest ways to create a drawdown spike while pretending to diversify. A trader opens long EUR/USD, long GBP/USD, short USD/CHF, and long AUD/USD. Four tickets. One broad anti-dollar position. If the dollar strengthens, the losses do not arrive independently. They arrive as a group.
The same problem appears with yen crosses, commodity-linked currencies, and euro bloc exposure. The account may show separate trades, but the portfolio is loaded in one direction. Retail platforms make this worse because they display each position cleanly as its own line. The risk is not always visible unless the trader maps the exposure manually.
Here is a practical way to read it:
| Position mix | What it may really mean | Drawdown risk |
|---|---|---|
| Long EUR/USD + long GBP/USD | Short USD twice | Losses can compound on dollar strength |
| Long AUD/USD + long NZD/USD | Similar risk sentiment exposure | Both can weaken in risk-off moves |
| Short USD/JPY + short EUR/JPY | Long JPY exposure | Yen strength helps, yen weakness hurts both |
| Long EUR/USD + short USD/CHF | Overlapping anti-dollar view | Less diversified than it appears |
| Multiple GBP pairs before UK data | Concentrated sterling event risk | One release can hit the basket |
This is not an argument against holding multiple trades. It is an argument against counting tickets instead of exposure. If I risk 1% on each of four highly correlated positions, I may not be risking 1% four times independently. I may be risking something close to 4% on one macro idea.
That is how a trader following a “1% rule” still gets hit with a sharp drawdown. The rule was applied per ticket, not per idea.
A better method is to cap total exposure by currency and theme. If several trades depend on the same dollar weakness view, the combined risk should fit inside one planned risk bucket. That may mean taking the cleanest setup only. It may mean splitting the risk across two pairs. It should not mean pretending the account has diversification because the symbols are different.
The 10–20% line: when to stop and reassess
Many traders set a maximum drawdown threshold around 10% to 20% before re-evaluating a strategy. I like that range as a practical warning zone, not as a universal rule. The right threshold depends on strategy type, leverage, trade frequency, and the trader’s ability to execute under stress.
A high-frequency intraday system may need a tighter review trigger because many trades can stack up quickly. A longer-term swing strategy may tolerate a slower drawdown if risk per trade is controlled and the sample size is still small. But once an account is down 10%, I want to know exactly why. Once it approaches 20%, I want size reduced or trading paused unless there is hard evidence that the strategy is still behaving inside expected limits.
The review should not be vague. “Market conditions changed” is not enough. I would separate the drawdown into categories:
- Losses from planned trades that followed the rules.
- Losses from trades that violated entry criteria.
- Losses from moved or removed stops.
- Losses enlarged by slippage or spread widening.
- Losses from correlated positions.
- Losses from increased size after prior losses.
This breakdown usually exposes the truth quickly. If most losses came from valid trades, the strategy may be in a normal losing cycle or may need adjustment. If the losses came from rule breaks, the strategy is not the main issue. The trader is.
There is no shame in reducing size during a drawdown. In fact, it is one of the few moves that makes mathematical sense. Lower size gives the trader more samples, less emotional pressure, and more time to find out whether the edge is still present. Increasing size during a drawdown does the opposite. It shortens the runway.
A realistic drawdown-control routine
I do not trust risk plans that only work when the trader is calm and the spread is tight. A usable plan has to survive bad fills, losing streaks, and the temptation to recover too fast.
The routine I prefer is blunt:
1. Risk 1% or less until the strategy has a verified live record. Backtests and demos help, but live execution changes the numbers. Slippage, hesitation, partial fills, and spread behavior are real costs.
2. Use 2% only when the setup, account size, and execution history justify it. Two percent risk is not reckless by itself, but it becomes reckless when stacked across correlated trades or used during volatile news.
3. Set a minimum realistic R:R before entry. A 1:2 target is a useful benchmark, but only if the pair and timeframe can actually reach it after costs.
4. Define maximum open risk. If three trades are open, know the combined loss if all stops hit. Do not discover it after the move.
5. Reduce risk after a drawdown threshold. A simple rule is to cut risk per trade after a 5% or 10% equity drop. This slows the decline and lowers emotional pressure.
6. Separate strategy loss from execution loss. If slippage and spreads are consistently worse than expected, the strategy may not be broken. The venue or trading time may be unsuitable.
7. Stop trading after rule violations. Not after losses. After violations. A planned loss is data. A revenge trade is contamination.
This is not glamorous. It is also how accounts stay alive long enough for an edge to matter.
The uncomfortable truth is that many traders want a better entry signal when they need a smaller position size. They want a cleaner indicator when they need a daily loss limit. They want a new strategy when they need to stop trading four dollar pairs in the same direction.
Verdict: drawdown spikes are usually built before the loss appears
Drawdown percentage spikes in forex are not random account weather. They usually come from identifiable pressure points: excessive position sizing, weak stop discipline, revenge trading, slippage during volatile conditions, and correlated exposure masquerading as diversification.
The trader cannot eliminate drawdown. Any serious strategy has losing periods. But the trader can decide whether those losing periods stay within planned damage or become account-changing events.
My practical verdict is simple. If your drawdown spikes faster than your strategy logic says it should, do not start by changing indicators. Audit the boring parts first: risk per trade, total open exposure, real R:R after spread, stop execution, and behavior after losses. That is where the expensive problems usually hide.